California Cybersecurity Risk Report 2027
Bracketed identifiers such as [C-001] refer to entries in the Claim Evidence Register, where every quantitative statement in this report is traced to its source, method, and limitations. The full evidence package — registers, methodology, raw data, and analysis scripts — is linked at the end of this report.
1. Executive Summary
California is the largest single target of cybercrime in the United States, and the gap between California and everywhere else widened sharply in the most recent year of complete federal data. In 2025, Californians filed 116,414 complaints with the FBI's Internet Crime Complaint Center (IC3) and reported $3.67 billion in losses — first in the nation on both measures [C-001]. Reported losses grew 44.7 percent in a single year, more than twice the state's 20.9 percent growth in complaint volume, meaning each incident is getting more expensive, not just more common [C-002]. Averaged across the year, Californians reported losing roughly $10.1 million to internet crime every day [C-003].
California's exposure is disproportionate even after accounting for its size. The state generated 11.5 percent of the nation's complaints but 17.6 percent of its reported losses [C-004], and its average reported loss per complaint — $31,566 — ran 52 percent above the national average [C-006]. On a per-resident basis, California ranked first among all fifty states in reported losses, at $93.37 per resident, trailing only the District of Columbia overall [C-005].
Two channels dominate the loss picture. Complaints with a cryptocurrency connection accounted for $2.10 billion — 57 percent of everything Californians reported losing in 2025 [C-007]. And Californians aged 60 and over reported $1.40 billion in losses, 38 percent of the state total from 19 percent of complaints [C-008].
This report also contributes an original analysis of California's own breach-notification record. intSignal Research analyzed 1,536 breach notices submitted to the California Attorney General between January 2024 and August 2026 — the complete public register for that window [C-010]. The central finding: the median notice arrives about six months (174 days) after the breach occurred, only 4 percent of notices arrive within 30 days of the breach, and one in six arrives more than a year later [C-011]. The register also shows, in California's own data, the vendor-concentration problem national research has been warning about: a single third-party incident dated February 21, 2024 generated notices from 32 distinct organizations [C-013]. With Senate Bill 446's fixed 30-day notification deadline now in effect [C-015], notification speed becomes a measurable compliance question — and the early 2026 data suggests the gap between the law's intent and current practice remains wide [C-016].
For California's small and mid-market businesses, the practical implications concentrate on a short list: identity and email controls, patching of internet-facing systems, vendor risk, and recoverable backups. Section 9 grounds each in the evidence.
2. Key Findings
California cybercrime losses jumped 44.7 percent in one year. Reported losses rose from $2.54 billion (2024) to $3.67 billion (2025), while complaints rose 20.9 percent, from 96,265 to 116,414 [C-002]. Measured from 2023, complaints are up 50.7 percent and losses up 70.1 percent in two years [C-009].
Californians reported losing about $10.1 million per day to internet crime in 2025 — an average of 319 complaints filed daily [C-003].
California is the costliest state per resident. At $93.37 in reported losses per resident, California ranked first among states and second only to the District of Columbia [C-005]. California's total was 2.0 times second-ranked Texas ($1.83 billion) [C-012].
Losses are outpacing incidents. California's average reported loss per complaint reached $31,566 in 2025, 52 percent above the national average of $20,699 [C-006].
Cryptocurrency is the dominant loss channel. Complaints referencing cryptocurrency accounted for $2.10 billion, 57 percent of California's reported losses [C-007].
Older Californians carry a disproportionate share. Residents 60 and over reported $1.40 billion in losses — 38 percent of the state total on 19 percent of complaints [C-008].
California breach notices arrive a median of 174 days after the breach. Across 1,442 notices with usable dates filed with the Attorney General from January 2024 through August 2026, only 4.2 percent arrived within 30 days of the breach occurring; 49 percent took more than six months and 16 percent took more than a year [C-011].
Vendor breaches cascade through California's economy. One third-party incident (breach date February 21, 2024) produced Attorney General notices from 32 distinct organizations; another (October 29, 2023) produced notices from eight insurers plus six from the vendor itself. The most frequent notifiers in the register are data-processing and administrative vendors, not household names [C-013, C-014].
Third-party and vulnerability-driven intrusions define the national breach picture. In Verizon's 2026 Data Breach Investigations Report, ransomware appeared in 48 percent of breaches, third-party involvement reached 48 percent of breaches (up 60 percent year over year), and vulnerability exploitation overtook stolen credentials as the leading initial access vector at 31 percent [C-017, C-018, C-019].
Federal ransomware loss figures materially understate impact. IC3 recorded only $32.3 million in national ransomware losses on 3,611 complaints in 2025, but the FBI's own caveat notes this excludes downtime, lost business, and remediation, and reflects only what victims report [C-020]. Among ransomware complaints from outside critical infrastructure, legal services (18 percent), contracting (17 percent), and engineering and architectural services (10 percent) led — a profile that matches California's small-business economy [C-021].
3. The California Cybersecurity Landscape
California concentrates the conditions that attract cyber-enabled crime: the largest state population and economy in the country, the highest concentration of technology and financial activity, a large population of older residents with accumulated assets, and millions of small businesses that run on email, cloud services, and third-party vendors. The 2025 federal data shows that this concentration translates into more than proportional exposure — California's share of national losses (17.6 percent) far exceeds its share of complaints (11.5 percent) [C-004], and its per-resident loss rate leads all states [C-005].
California is also the country's regulatory bellwether. It enacted the first state breach-notification law in 2002, and in October 2025 it moved again: Senate Bill 446 replaced the long-standing "most expedient time possible" standard with a fixed deadline — affected Californians must be notified within 30 calendar days of discovery, and the Attorney General within 15 calendar days after consumers are notified, for breaches affecting more than 500 California residents [C-015]. Section 5 measures current notification practice against the world that law envisions.
Because state-level data on business victimization is thin, this report builds on the strongest available public records: the FBI's IC3 state tables (the only annual, state-comparable cybercrime series), the California Attorney General's breach-notification register (a California-specific, incident-level record), and national incident research (the Verizon DBIR) for the mechanics of how organizations are actually breached. Each source's blind spots are addressed in Section 12.
4. Cybercrime and Financial Loss: What the Federal Data Shows for California
The IC3 series is the closest thing that exists to a state-level cybercrime ledger. Its trajectory for California over four years:
| Year | CA complaints | CA reported losses | CA rank (losses) |
|---|---|---|---|
| 2022 | 80,766 | more than $2.0B | 1st |
| 2023 | 77,271 | $2.16B | 1st |
| 2024 | 96,265 | $2,539,041,635 | 1st |
| 2025 | 116,414 | $3,674,716,305 | 1st |
Sources: FBI IC3 annual reports 2022–2025 [C-001, C-009]. See Chart CH-01 and CH-02.
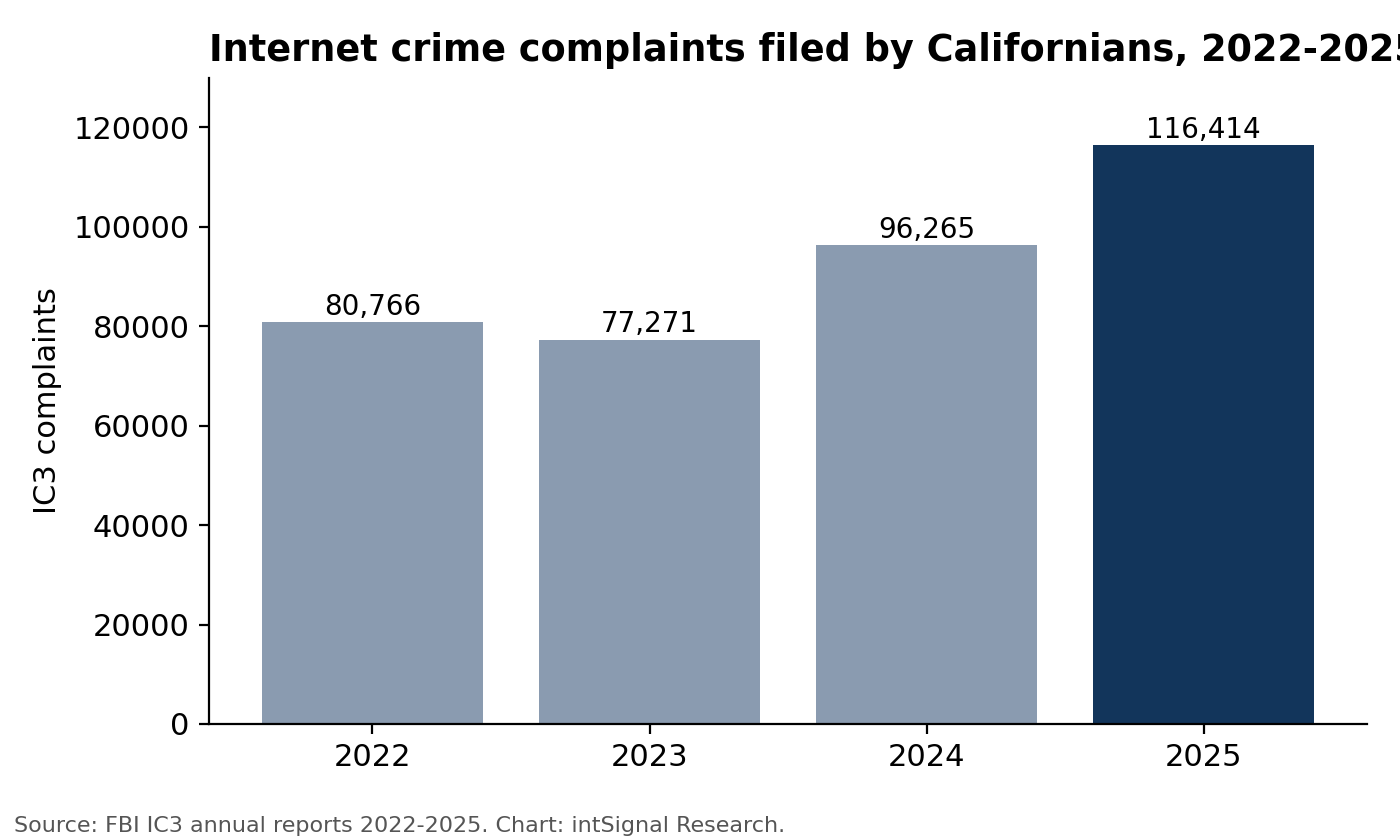
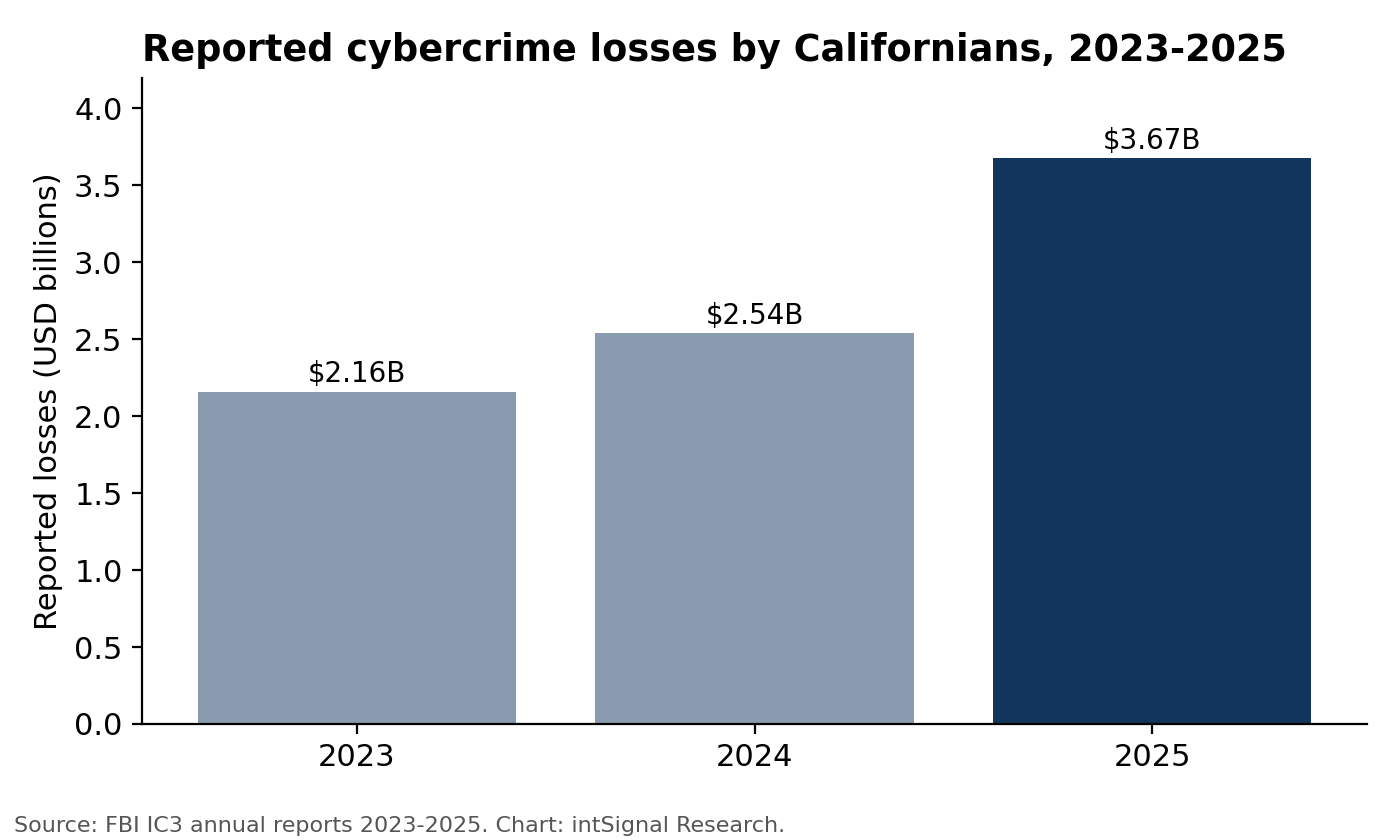
Two features stand out. First, the acceleration: after a roughly flat 2022–2023, complaints rose 24.6 percent in 2024 and another 20.9 percent in 2025, while losses rose 17.5 percent and then 44.7 percent [C-002]. Second, the widening severity gap: the average reported loss per California complaint reached $31,566 in 2025, against a national average of $20,699 [C-006]. Part of this reflects the composition of California fraud — heavier weighting toward high-dollar categories such as cryptocurrency investment fraud — and part likely reflects the state's wealth profile. The data does not distinguish these drivers, and this report does not attribute the gap to any single cause.
The category detail available for California points at the channels. Complaints referencing cryptocurrency produced $2.10 billion in California losses in 2025, 57 percent of the state total and the highest of any state [C-007]. Nationally, cryptocurrency-linked losses reached $11.37 billion (up 22 percent year over year), with investment fraud alone accounting for $7.2 billion [C-022]. The FBI's Los Angeles field office identified cryptocurrency fraud, extortion, and phishing/spoofing as the most-reported crime types among Californians in 2024, the most recent year for which it published a state crime-type breakdown [C-023].
The age distribution is equally consequential. California complainants aged 60 and over filed 22,157 complaints and reported $1.40 billion in losses in 2025 — first in the nation, 38 percent of the state's losses from 19 percent of its complaints [C-008]. Nationally, losses reported by the 60+ population rose 59 percent in 2025 to $7.7 billion [C-024]. For businesses this is not a consumer-only story: family offices, trusts, medical practices, and professional firms serving older Californians sit directly in the path of these fraud flows, and employee-targeted variants (executive impersonation, payroll diversion, real-estate wire fraud) use the same techniques.
A necessary caution: IC3 data measures what victims report. The FBI itself has estimated, based on the takedown of one ransomware group's infrastructure, that only about 20 percent of that group's victims had reported to law enforcement [C-025]. Every figure in this section is therefore a floor, not an estimate of true losses.
5. California Data Breach Analysis: What the Attorney General's Register Shows
California law requires any organization breaching the personal information of more than 500 California residents to submit a sample notice to the Attorney General, which publishes the register — organization name, breach date(s) where known, and date reported. intSignal Research captured the full public register export on August 25, 2026 and analyzed all 1,536 notices reported between January 2, 2024 and August 24, 2026 [C-010]. Methods, inclusion rules, and the verbatim capture are in the research package; no records were removed or altered.
Volume is high and stable. Organizations filed 608 notices in 2024, 565 in 2025, and 363 in 2026 through August 24 — statistically flat against the same period of 2025 (361 notices, +0.6 percent) [C-026]. Roughly every business day, at least two organizations tell the California Attorney General they have breached the personal data of more than 500 Californians.
Notification is slow, measured from when the breach actually happened. For the 1,442 notices listing at least one usable breach date, the median gap between breach occurrence and Attorney General notification was 174 days. Only 4.2 percent of notices arrived within 30 days of the breach; 13.6 percent within 60 days; 49 percent took longer than six months; 16 percent took longer than a full year [C-011]. The longest gap in the window approached ten years. To be precise about what this measures: the legal clock under California law runs from discovery of a breach, not occurrence, and a long occurrence-to-notice gap is not by itself a legal violation. What the gap does measure is the real-world exposure window — the time during which affected Californians' data was compromised but they had not yet been told through this channel. That window is typically about six months. (Chart CH-03.)
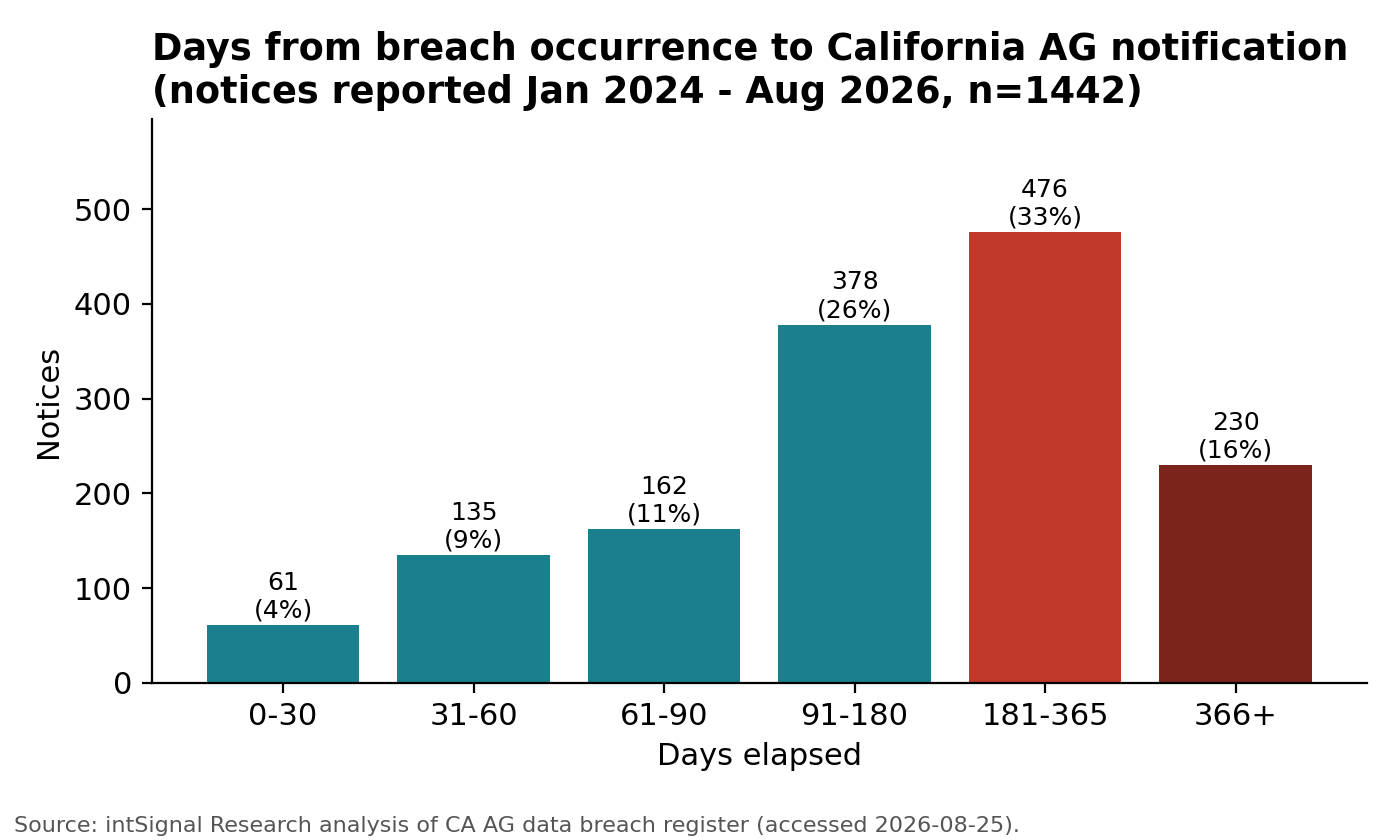
Early evidence from the SB 446 era. Among notices filed in 2026 for breaches that began on or after January 1, 2026 — the first incidents arising fully under the new fixed-deadline regime — the median occurrence-to-notice gap was 70 days, and 41.7 percent arrived within 60 days [C-016]. That is markedly faster than the legacy pattern, but two caveats apply. First, this early cohort is right-censored: slower notices for 2026 breaches simply have not arrived yet, so the true 2026 median will rise as the year completes. Second, even in this fastest-available cohort, only 13.6 percent of notices arrived within 30 days of the breach occurring. The 2027 edition of this report will re-measure the full 2026 cohort; it is the first year for which SB 446 compliance can be meaningfully benchmarked.
The register documents California's vendor-concentration problem directly. Sorting notices by shared breach-date signatures reveals cascades in which one incident at a service provider generates notices from many downstream organizations [C-013]:
| Breach date signature | Distinct organizations filing | Pattern |
|---|---|---|
| 02/21/2024 | 32 | Pharmaceutical manufacturers and patient-assistance programs notifying after an incident at a shared distribution/services provider |
| 12/13–12/16/2024 | 9 | Affiliated California radiation-oncology practices |
| 11/01/2024 (incl. combined signatures) | 14 | California community health centers tied to shared administrative infrastructure |
| 10/29/2023 | 8 | Life insurers and retirement-plan providers notifying after an incident at a shared benefits-platform vendor |
| 05/30/2023 | 5+ | Organizations downstream of the 2023 mass file-transfer software exploitation |
The most frequent notifiers in the register are, likewise, mostly data processors and administrative vendors rather than consumer brands: one healthcare data-services firm filed ten notices in the window, a business-process outsourcer nine, a debt-collection services firm nine, a benefits administrator seven, and an insurance-platform vendor six [C-014]. For any California business, the register's plain message is that your breach is frequently someone else's breach — your payroll processor, benefits administrator, billing vendor, or software provider — and your notification obligations attach regardless.
6. Major Threat Categories
Cyber-enabled fraud produced 85 percent of all losses reported to IC3 in 2025 ($17.7 billion nationally) [C-027]. Investment fraud was the costliest category at $8.65 billion, followed by business email compromise at $3.05 billion (24,768 complaints) and tech/customer-support fraud at $2.13 billion [C-028]. BEC deserves particular attention from businesses: it remains the second-costliest crime type in America with a six-figure average loss per complaint, it targets ordinary payment workflows rather than exotic technology, and wire transfer/ACH was the reported transaction channel in 86 percent of BEC losses [C-029].
Ransomware presents a measurement paradox. IC3 logged 3,611 ransomware complaints nationally in 2025 (up 14 percent) with just $32.3 million in reported losses — but the FBI states explicitly that this figure excludes lost business, downtime, wages, files, equipment, and third-party remediation, and that many victims report no loss amount or do not report at all [C-020]. The incident-based view is starker: ransomware appeared in 48 percent of confirmed breaches in the 2026 DBIR, up from 44 percent, even as 69 percent of victims declined to pay and the median payment fell to $139,875 [C-017]. The FBI identified 63 new ransomware variants in 2025; Akira, Qilin, INC/Lynx/Sinobi, BianLian, and Play were the most reported [C-030]. Outside critical infrastructure, the businesses most frequently reporting ransomware to IC3 were law firms and legal services (18 percent), contractors (17 percent), engineering and architectural firms (10 percent), and consultancies (7 percent) [C-021] — small and mid-sized professional businesses, heavily represented in California.
Vulnerability exploitation overtook stolen credentials in the 2026 DBIR as the most common initial access vector, at 31 percent of breaches (from 20 percent a year earlier), driven substantially by attacks on edge devices, VPNs, and remote-access infrastructure [C-019]. Remediation is moving the wrong direction: only 26 percent of vulnerabilities on CISA's Known Exploited Vulnerabilities catalog were fully remediated in the DBIR dataset, down from 38 percent, with median time to full remediation rising from 32 to 43 days [C-031].
Credential theft and phishing remain pervasive rather than displaced: credential abuse appeared in 39 percent of full breach chains in the 2026 DBIR, and infostealer-to-ransomware pipelines are now documented — half of ransomware victims with a prior credential leak were attacked within 95 days of the leak [C-032]. Phishing/spoofing was again the most-reported crime type nationally (191,561 complaints) [C-028].
Third-party compromise is the fastest-growing structural risk: 48 percent of DBIR breaches involved a third party, a 60 percent increase over the prior year's 30 percent [C-018]. Section 5 shows the same dynamic inside California's own notification record.
AI-enabled crime entered the federal record formally in 2025: IC3 tracked 22,364 complaints with an AI nexus and $893 million in associated losses, concentrated in investment fraud ($632 million) and including roughly $30 million in AI-assisted BEC [C-033]. The DBIR's parallel finding is that attackers are using generative AI to accelerate and scale established techniques — phishing, malware development, vulnerability research — rather than to invent new categories of attack [C-034].
7. California Versus the Nation
Where comparable measures exist, California's profile diverges from the national pattern in consistent directions. Its loss growth outpaced the country's (44.7 percent versus 26 percent in 2025) [C-002, C-035]. Its average loss per complaint runs half again the national figure [C-006]. Its per-resident losses lead all states [C-005]. Its cryptocurrency exposure is the largest in absolute terms of any state, and cryptocurrency's 57 percent share of California losses exceeds the 54 percent share nationally [C-007, C-022]. Its complaint rate per resident, by contrast, is unremarkable — 13th among states at 295.8 per 100,000 [C-036] — which is another way of seeing the core finding: California's problem is less that more people are victimized than that victimization in California costs far more per incident.
One comparison this report deliberately does not make: no state-level equivalent of the DBIR's breach-mechanics data exists, so claims about how California organizations specifically are breached (initial vectors, dwell times) cannot be supported and are not made here. National mechanics plus California's own notification record are the honest limits of the evidence.
8. Implications for Small and Mid-Market Organizations
The evidence in this report intersects with the small and mid-market business population in four specific ways.
First, the fraud channels driving California's loss growth run through business workflows. BEC's $3.05 billion in national losses moves through ordinary invoice, payroll, and wire processes [C-028, C-029]; real-estate wire fraud ($275 million nationally) runs through escrow and title workflows [C-028]. These attacks succeed against companies of every size because they attack process, not infrastructure.
Second, the ransomware reporting profile outside critical infrastructure — law firms, contractors, engineering firms, consultancies [C-021] — is a census of California's professional small-business economy. These are firms that hold sensitive client data, depend completely on operational continuity, and rarely maintain internal security staff.
Third, the third-party findings cut both directions for smaller firms. They are downstream victims of vendor breaches, as the Attorney General's register cascades demonstrate [C-013]; and they are themselves the third party in larger customers' supply chains, which increasingly makes their security posture a condition of doing business, not just a risk decision. The DBIR's observation that only 23 percent of third-party organizations fully remediated missing MFA on cloud accounts describes the population many small firms belong to [C-037].
Fourth, breach obligations now carry a clock. SB 446's 30-day consumer deadline means a California business discovering a breach must be able to investigate, scope, and notify within a month [C-015] — a timeline the historical record suggests most organizations have not been operating anywhere near (Section 5). Meeting it requires incident-response readiness before the incident: logging that supports scoping, a tested response plan, counsel and notification vendors identified in advance.
9. Security Priorities for 2027
Each priority below is stated with the evidence that justifies it; none depends on any particular product or provider.
Phishing-resistant multi-factor authentication and identity hygiene. Credential abuse appears in 39 percent of breach chains [C-032]; the FBI's first-line ransomware recommendations center on MFA, eliminating default credentials, and least privilege [C-038]. MFA on email, VPN, and financial systems addresses the mechanisms behind BEC and account takeover simultaneously.
Payment-verification controls. Given BEC's $3.05 billion toll and its 86 percent reliance on wire/ACH [C-028, C-029], out-of-band verification of any new or changed payment instructions is the single highest-leverage fraud control available to a business, at near-zero cost. When fraud occurs anyway, speed matters: the FBI's Financial Fraud Kill Chain froze $679 million of $1.16 billion in attempted thefts in 2025 — a 58 percent success rate that depends on immediate reporting to the bank and IC3 [C-039].
Prioritized patching of internet-facing systems. With vulnerability exploitation now the top initial access vector [C-019] and KEV remediation rates falling [C-031], patching internet-facing and edge systems against known-exploited vulnerabilities — on a days-not-months cadence — is the clearest gap the 2026 data exposes.
Vendor risk management with teeth. The register cascades [C-013] and the DBIR third-party findings [C-018, C-037] justify maintaining a current inventory of vendors holding company or customer data, contractual breach-notification requirements shorter than the statutory maximum, and verification of vendors' MFA and access controls rather than questionnaire self-attestation.
Immutable, tested backups and network segmentation. The 69 percent of ransomware victims who refused to pay [C-017] describe the position every organization should engineer for: refusal is only possible when restoration is. The FBI's specific recommendations — encrypted, immutable, offline backups covering the full data estate; segmentation to contain spread; EDR-supported detection of lateral movement — are reproduced in the evidence register [C-038].
Incident-response readiness scaled to SB 446. A written and rehearsed plan, pre-identified counsel and forensics support, and logging sufficient to scope a breach within days are now effectively regulatory requirements for any organization holding data on more than 500 Californians [C-015].
10. Outlook
Three measurable questions will define the 2028 edition. Whether California's loss curve bends: 2026 IC3 data (expected spring 2027) will show whether the 44.7 percent surge was an inflection or an outlier; the 60-percent-plus two-year growth in AI-assisted fraud losses nationally suggests upward pressure continues [C-033]. Whether SB 446 changes notification behavior: the full 2026 breach cohort will provide the first uncensored measurement of the new regime, against the 174-day historical baseline established here [C-011, C-016]. And whether vendor concentration keeps amplifying single incidents into statewide notification events: the register makes this directly observable year over year [C-013]. intSignal Research will maintain all three measurements on consistent methodology to support year-over-year comparison.
11. Methodology (Summary)
Full methodology, including every calculation, inclusion rule, and transformation, is published in the accompanying research package (04_METHODOLOGY.md); the register capture, analysis scripts, and computed outputs are included so that every figure can be independently re-derived.
In brief: IC3 figures are transcribed from the FBI's published annual reports (2022–2025 editions) and state tables; intSignal calculations on them are arithmetic (year-over-year change, shares, per-day averages) with formulas documented per claim. The Attorney General register analysis uses a verbatim capture of the state's public CSV export (accessed August 25, 2026) covering all notices reported January 2, 2024 through August 24, 2026; notices are the unit of analysis; lag is measured from the earliest listed breach date to the reported date; rows without usable dates are excluded from lag statistics only (90 with no breach date, 4 with only future-dated breach dates) and retained in all counts. DBIR figures are quoted from the Verizon 2026 report. No surveys were conducted; no intSignal customer data was used; nothing in this report extrapolates from intSignal's client base.
12. Limitations
IC3 data is self-reported victim data: it undercounts true incidence (the FBI's own Hive-infrastructure analysis suggested roughly 20 percent of that group's victims reported [C-025]), state attribution follows the complainant's stated location rather than where a business victim operates, and "complaints" are not deduplicated victims. Loss figures are reported, not verified. The Attorney General register records notices, not incidents — one incident can generate many notices and one notice can cover multiple breach dates — and includes only breaches exceeding 500 affected Californians, so small breaches are invisible to it; breach dates are as reported by filers and contain occasional errors, handled by the documented exclusion rules. The occurrence-to-notice lag is not a compliance measurement, because the statute runs from discovery. The 2026 SB 446-era cohort is right-censored and will lengthen as late notices arrive. DBIR findings describe a global incident dataset, not California specifically. The 2022 California loss figure is sourced at reported precision ("more than $2 billion") and excluded from percentage calculations. Register counts derive from a verbatim capture of the state's export; independent verification against a fresh download is recommended before publication and documented as a pre-publication step in the package index.
13. Sources
Primary sources, in priority order used: FBI Internet Crime Complaint Center annual reports (2025, published April 2026; 2024; 2023; 2022) and FBI Los Angeles field office state releases; California Attorney General data breach register and public CSV export (accessed August 25, 2026); California SB 446 (2025) and analyses of its notification deadlines; Verizon 2026 Data Breach Investigations Report (published May 2026); CISA Known Exploited Vulnerabilities program (as reported in DBIR 2026). Complete citations with URLs, publication dates, and access dates: 02_SOURCE_REGISTER.csv.
14. Data Availability
All underlying materials — the register capture, analysis scripts, computed outputs, chart data, and per-claim evidence — are published in the intSignal Research package accompanying this report. Sources that cannot be redistributed are documented with access instructions. See 06_DATA_AVAILABILITY.md.
15. About intSignal Research
intSignal Research is the research publishing arm of intSignal, a managed IT, cybersecurity, and telecommunications services company based in Orange County, California. intSignal Research publishes evidence-based analyses of public datasets relevant to California businesses. Its work uses public data only, documents every calculation, and is published with a full evidence trail so that findings can be independently verified. Corrections are logged publicly. Contact and correction requests: via intsignal.com.