Cloud Observability: Logs, Metrics, and Traces That Help

Monitoring answers known questions; observability answers new ones
Monitoring tells you whether the things you already worried about are healthy: is CPU high, is the queue backing up, did the health check pass. It works from a fixed list of questions you wrote in advance. That is necessary, and it is not enough for a distributed system where the failure you are staring at on Tuesday is one nobody predicted on Monday.
Observability is the property that lets you ask new questions of a running system without shipping new code to answer them. The practical test is simple: when a customer reports that checkout is slow for users in one region on one payment method, can you slice your telemetry down to exactly that population and see where the time went? If the answer requires adding a log line and waiting for the next deploy, you have monitoring, not observability. The difference is not a product you buy. It is whether your telemetry is rich and correlated enough to support open-ended investigation, and whether you can afford to keep it that way.
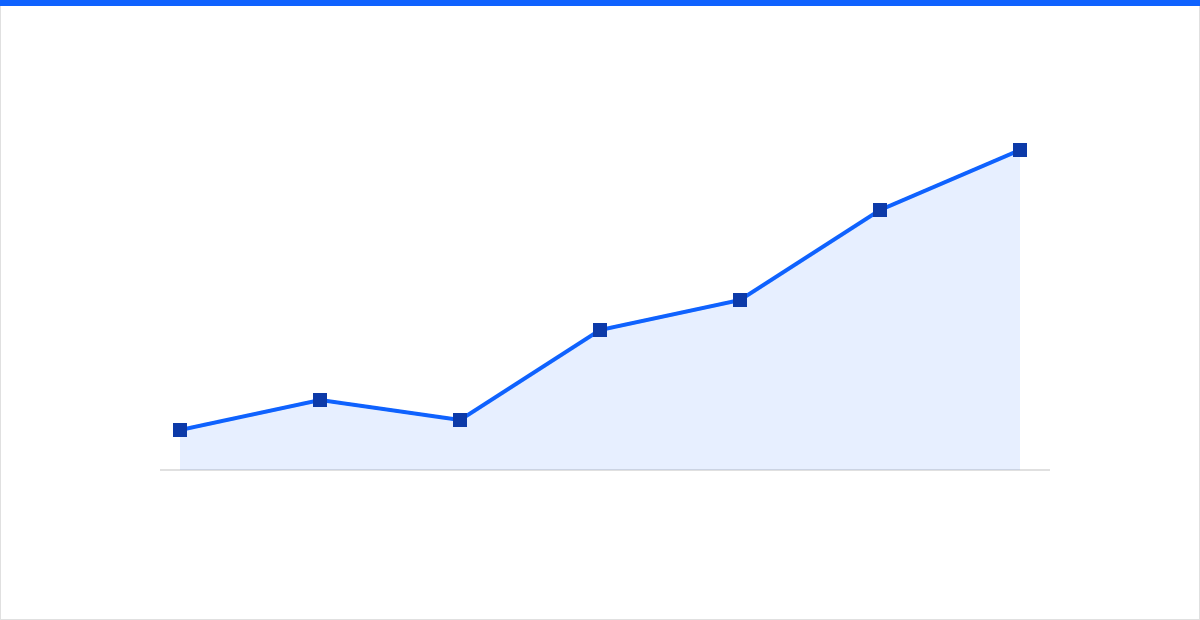 Figure: the earliest signal is usually a slope, not a threshold breach — latency drifting off its baseline while everything else looks green.
The three pillars, plus a fourth you should not ignore
Observability rests on three signal types, each answering a different question.
- Metrics are numeric measurements aggregated over time: request rate, error rate, p95 latency, saturation. They are cheap to store, fast to query, and ideal for dashboards, trends, and alerting. Their weakness is that aggregation throws away the individual event, so a metric tells you that latency rose, not which requests were slow or why.
- Logs are timestamped records of discrete events. They carry the detail metrics discard. Structured logs (key-value JSON rather than free text) are the ones worth keeping, because you can filter and aggregate them instead of grepping. Logs are the most expensive pillar to store at volume and the easiest to over-produce.
- Traces follow a single request across every service it touches, stitching the spans together with a shared trace ID. In a microservices or serverless architecture, traces are the only signal that shows you where the time actually went across a call chain, and which downstream dependency caused the tail latency.
The fourth signal is events: meaningful state changes such as deploys, config pushes, autoscaling actions, and feature-flag flips. Most incidents correlate with a change, and overlaying a deploy marker on a latency graph resolves more outages than any amount of dashboard staring. Feed the security-relevant events into your SIEM as well, because the same audit stream that explains an outage often explains an intrusion.
The pillars are only useful when they share context. If a metric, a log line, and a trace for the same request carry the same set of labels — service, version, region, customer tier — you can pivot from a spiking chart to the exact traces behind it to the logs inside those traces in one investigation. Correlation, not collection, is what makes the data pay off.
Cardinality is where the bill explodes
The single biggest driver of observability cost is cardinality: the number of unique label combinations you attach to your data. A latency metric tagged only by service has low cardinality. Add customer ID, request path, and instance ID and you can turn one time series into millions. Most managed platforms bill on exactly this — unique series, ingested log gigabytes, and indexed trace spans — so cardinality is not an engineering footnote, it is your invoice.
Control it deliberately:
- Keep high-cardinality data where it belongs. User IDs and request IDs belong on traces and logs, where you look at individual events, not on metric labels, where every unique value is a new series billed forever.
- Sample traces intelligently. You do not need 100 percent of traces. Tail-based sampling keeps the interesting ones — errors and slow requests — and drops the boring successful ones, often cutting trace volume by 90 percent or more while preserving the signal you actually investigate.
- Tier and expire your data. Keep high-resolution telemetry hot for days, downsample to coarser rollups for the medium term, and archive raw logs to cheap object storage. You rarely query last quarter's debug logs at per-second fidelity.
- Set a data budget per team. Left ungoverned, log volume grows with every deploy. A budget forces the useful-versus-noise conversation before the bill does.
Teams that skip this routinely spend more on observability than on the compute it watches. The goal is not less data — it is the right data retained at the right resolution for the right window.
SLOs and error budgets turn signals into decisions
Raw telemetry does not tell you whether to page someone or to keep shipping features. Service Level Objectives do. An SLO is a target for a user-facing indicator — say, 99.9 percent of checkout requests succeed in under 400 milliseconds over a rolling 28 days — measured by a Service Level Indicator computed from your metrics.
The error budget is the inverse of the objective. A 99.9 percent target permits roughly 43 minutes of failure per month. That budget is a shared currency: while it is healthy, engineering can push changes aggressively; when it is nearly spent, the team freezes risky work and spends down risk instead. It converts reliability from an argument into a number both engineers and product owners can act on, and it tells you which of your thousands of metrics are worth waking a human for — the ones that burn budget.
Alert on the burn rate, not the raw indicator. A fast burn (budget disappearing in an hour) pages immediately; a slow burn (a modest but persistent regression) opens a ticket. This is how mature teams cut alert volume without going blind.
OpenTelemetry and avoiding vendor lock-in
The historical trap in this space is instrumenting your entire codebase with one vendor's proprietary agents, then discovering that switching platforms means re-instrumenting everything. OpenTelemetry (OTel) is the open standard that breaks that trap. It is a CNCF project providing vendor-neutral APIs, SDKs, and a collector for metrics, logs, and traces across every major language.
The architecture that keeps you portable:
- Instrument once with OTel SDKs. Your application emits standard telemetry and knows nothing about the backend that stores it.
- Route through the OTel Collector. The collector receives, processes, batches, and exports your data. Changing vendors, or sending different signals to different backends, becomes a config change rather than a code change.
- Keep your instrumentation as an asset you own. Because the semantics are standardized, the effort you invest in good spans and attributes moves with you.
This portability is not just a negotiating chip. It lets you keep cheap, high-volume cloud metrics on one system while sending a sampled, high-value trace stream somewhere specialized, without instrumenting twice.
Alert on symptoms, not causes
The most common alerting mistake is paging on causes — CPU at 90 percent, a full disk, a restarted pod. Many of those conditions are transient or self-healing, and each one is a guess about what might hurt users. Page instead on symptoms your users actually feel: elevated error rate, latency past the SLO, a checkout success rate falling. Google's SRE "golden signals" — latency, traffic, errors, saturation — are a good symptom-first starting scorecard.
- Symptom alerts define whether you have a problem. Keep this list short and tied to SLOs; every entry should be worth a human's interrupted sleep.
- Cause metrics are for diagnosis after a symptom fires. Instrument them richly, dashboard them, but do not page on them.
This keeps the pager quiet enough to be trusted. When machine-driven correlation across signals is added — the domain of AIOps and machine learning — you can group a symptom with its likely cause automatically and cut mean time to resolution further, but the discipline comes first: alert on what users feel, then use the rich telemetry to explain it.
Where to start
You do not need a platform migration to make progress. Pick one critical user journey, define one SLO for it, instrument that path with OpenTelemetry so metrics, logs, and traces share context, and replace your noisiest cause-based alert with a single symptom alert tied to the budget. Then govern cardinality before the bill teaches you the hard way.
intSignal designs and runs cloud observability as a managed practice — from OTel instrumentation and collector pipelines through SLO definition, cost control, and alert tuning that on-call teams actually trust. If your dashboards are full but your incidents still surprise you, talk to our team and we will help you build observability that answers the questions you have not thought to ask yet.